Image Synthesis Homework 4
CPSC 6650 Program 3 Create an RGB image from the spectral image:
L(x,y,lambda) = (y/n_y) delta(lambda - (420(x/n_x) + 380)) use n_x = n_y =
512.
Extra Credit: Create an RGB image of the Macbeth color checker and
compare visually with the real thing.
First, let me explain some of my implementation. I'm going to do this
at the implementation level without deriving what goes into it.
Firstly, you need some tables which correlates wavelengths into x-tilda
y-tild and z-tilda. For a wavelength of 600, this should read
something like 1.0622 for x-tilda, .6310 for y-tilda, and .0008 for
z-tilda.
Next, you'll need a lookup function which linear interpolates
values. For example, a wavelength of 601 falls between 600 and 605
in the table. Thusly, we should get some fraction of the x-tilda
value at 600 and some lesser fraction of the x-tilda value at 605.
My look up function looks like the following:
float lookupx(double wavelength)
{
  if(wavelength < 375) // lower than the lowest x value
    return 0;
  if(wavelength > 780) // higher than the highest x value
    return 0;
  int val = wavelength-375; //subtract the base
  int i = val/5;            // i is the index (values go up by 5)
  double s = (wavelength-xWavelengths[i]) /
    (xWavelengths[i+1]-xWavelengths[i]);   // get the fractional value
  return (1-s)*xAmplitudes[i]+(s)*xAmplitudes[i+1]; //interpolate
}
Now, we have a function to look up x-tilda,y-tilda and z-tilda based
on the input wavelength. How do we get the input wavelength? Well
after some derivation, you'll see that what we want to do is compute
X, Y, Z. After some derivation with the function given in the
programming assignment, you see that you must do the following to
get X, Y and Z.
  X = 683 * y/n_y * lookupx(420 * x/n_x +380);
  Y = 683 * y/n_y * lookupx(420 * x/n_x +380);
  Z = 683 * y/n_y * lookupx(420 * x/n_x +380);
At this point we have X Y Z values. Well, some where in a book
you can look up a matrix to translate XYZ to RGB. HEre's the matrix
which I've used:
  [R]   [ 2.5623 -1.1661 -0.3962]  [X]
  [G] = [-1.0215  1.9778  0.0437]  [Y]
  [B]   [ 0.0752 -0.2562  1.1810]  [Z]
A typical code for this may look like the following:
      double scale = (double)683.f*((double)y/(double)n_y);
      double result = (420.0f*x/(double)n_x + 380);
      double X = scale*lookupx(result);
      double Y = scale*lookupy(result);
      double Z = scale*lookupz(result);
      double r =  2.5623*X -1.1661*Y -0.3962*Z;
      double g = -1.0215*X +1.9778*Y +0.0437*Z;
      double b =  0.0752*X -0.2562*Y +1.1810*Z;
      color_result = Color(r,g,b);
In any case my images are given with several variables. The
variables would change how the rgb values appear in the file.
The variables are:
overall_scale, scale_num, scale_denom, gamma
First off I got the min and max values for each r,g,b. After this my
idea was to completely place the values in the proper range. Thusly,
if the scales are all 1's, then every single r,g,b value given will
be plotted to the screen. For example, the red color is altered as
follows:
 color.r(
   overall_scale*(
      (color.r()-scale_num*min.r()) /
      (scale_denom*(max.r()-min.r()))));
 color.clamp(); //clamps to 0 -> 1
 color.gammacorrection(gamma); // applies gamma correction
Thusly, image files will appear with names like:
imagew.ww-x.xx-y.yy-z.zz.gif
w.ww is the overal_scale
x.xx is the scale_num
y.yy is the scale_denom (0 for this value means don't alter the pts
z.zz is the gamma
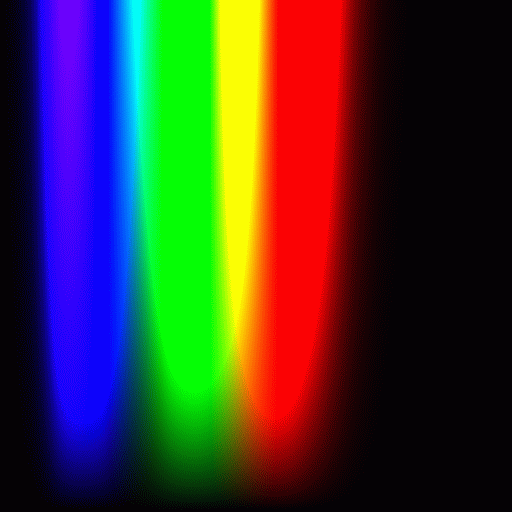
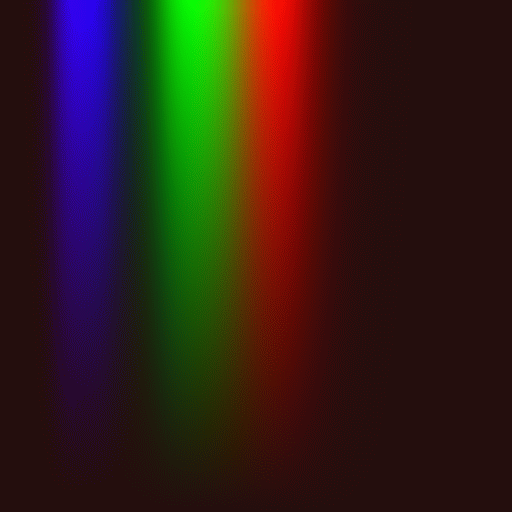
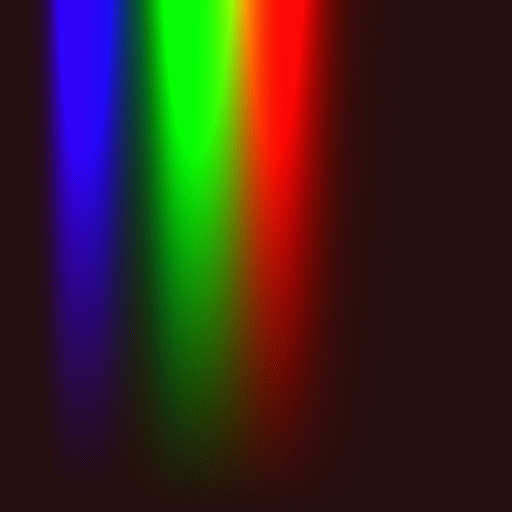
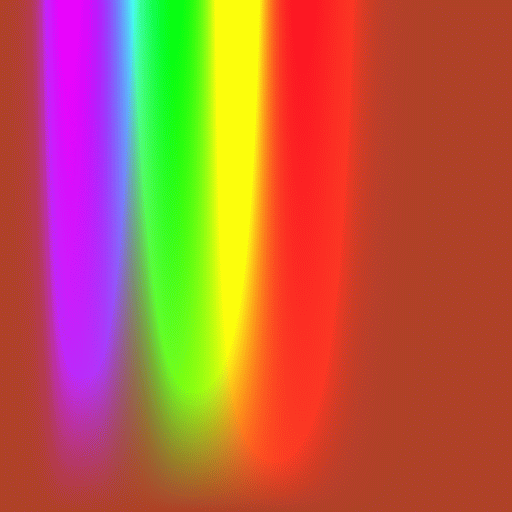
Here is one of my favorite image - its actually the only one that was
sampled more than once per pixel:
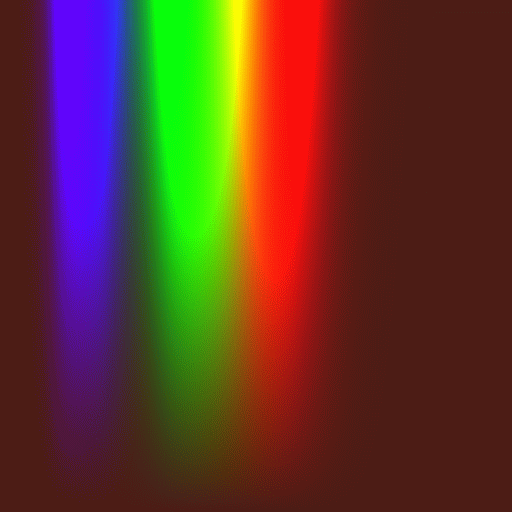
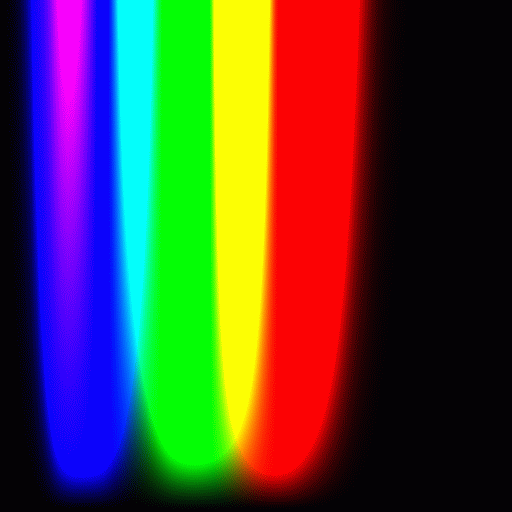
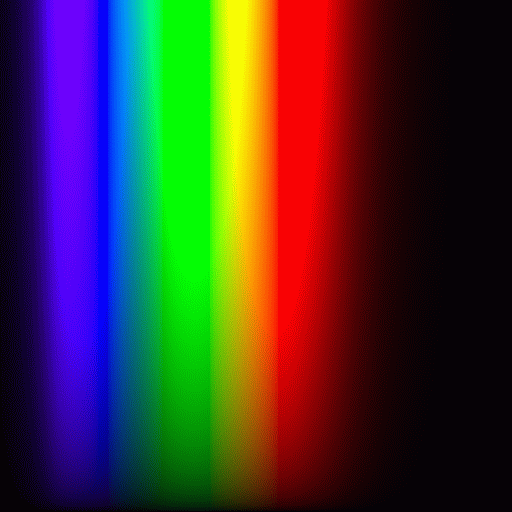
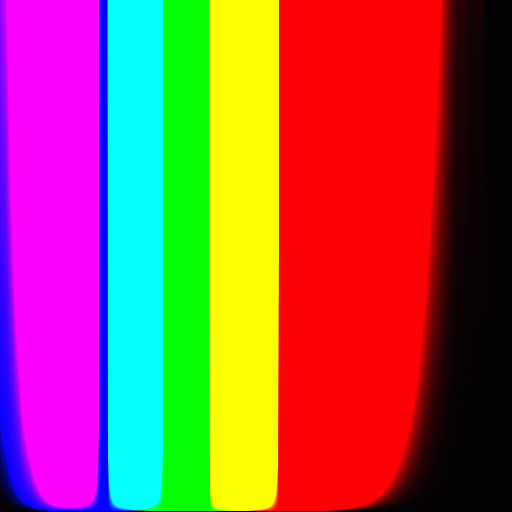
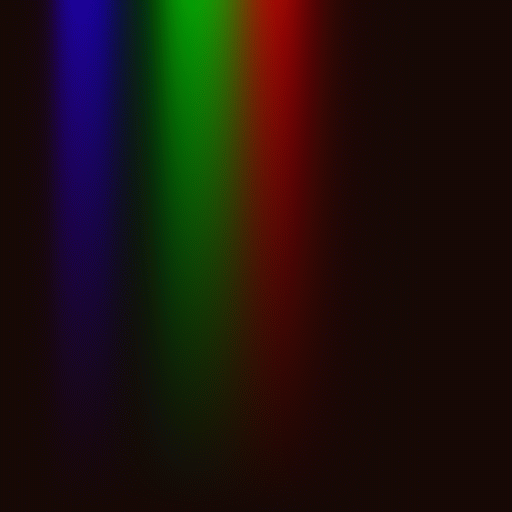
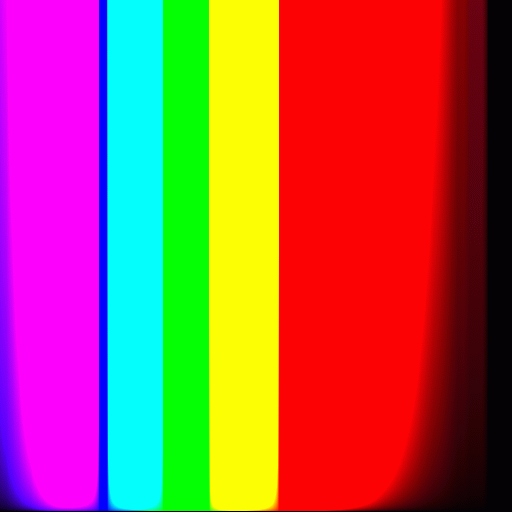
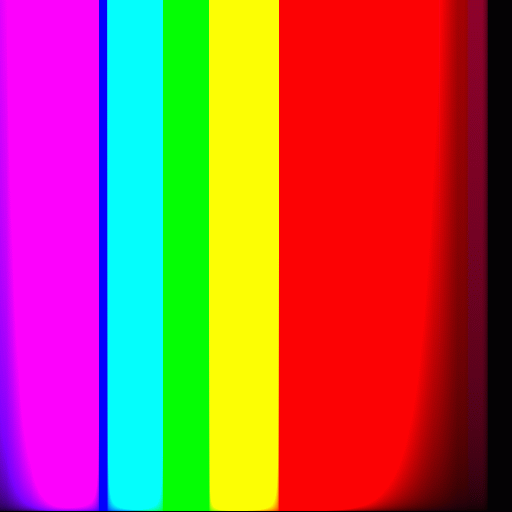
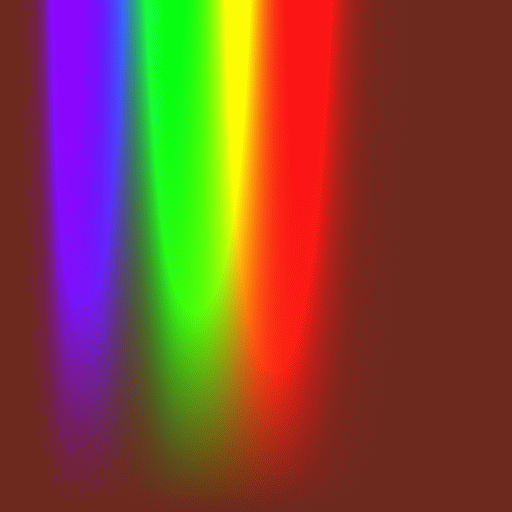
My second favorite clamps values against 500.
Here it is:

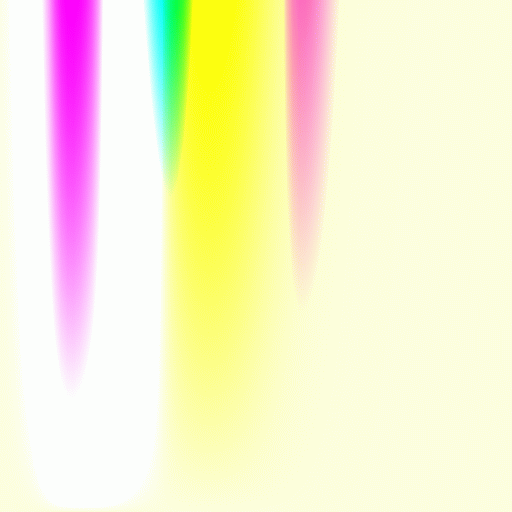
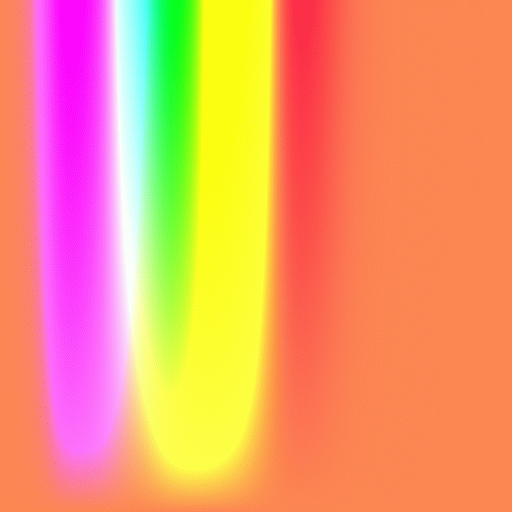
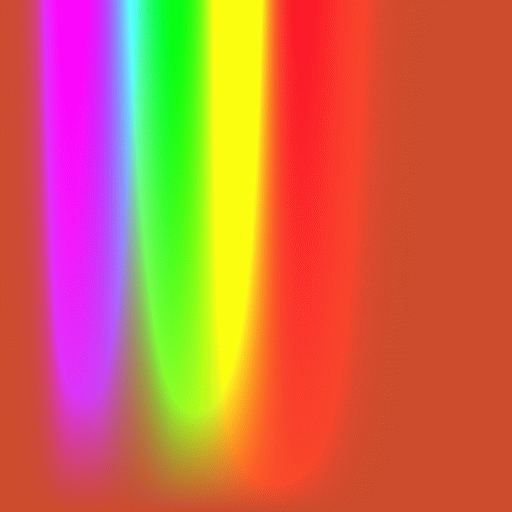
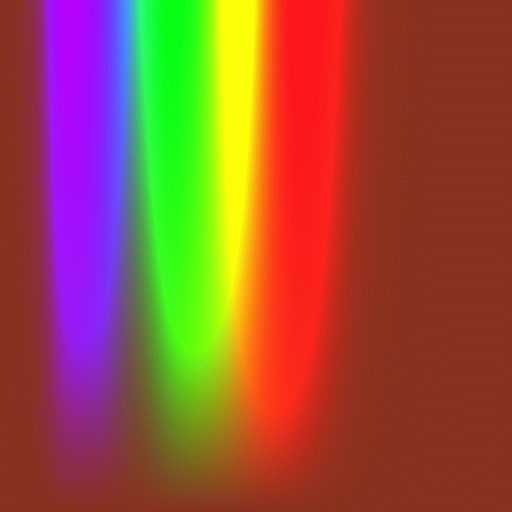
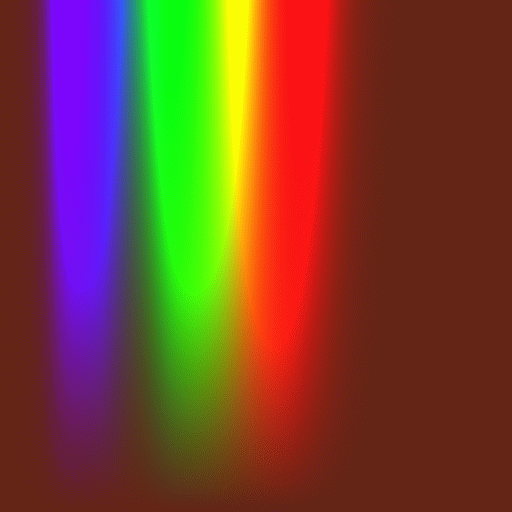
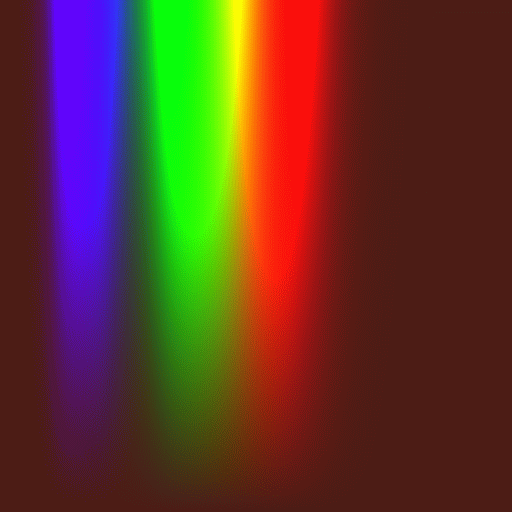
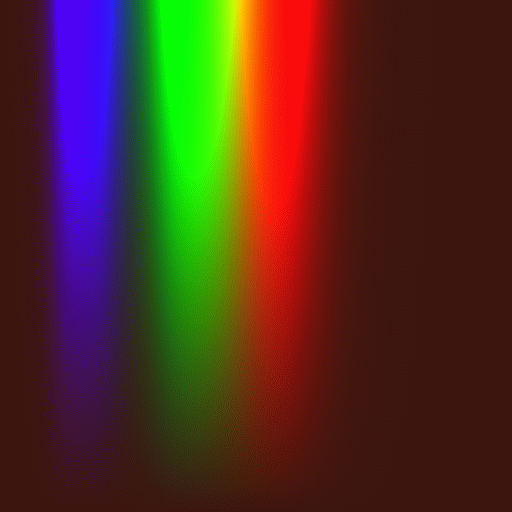
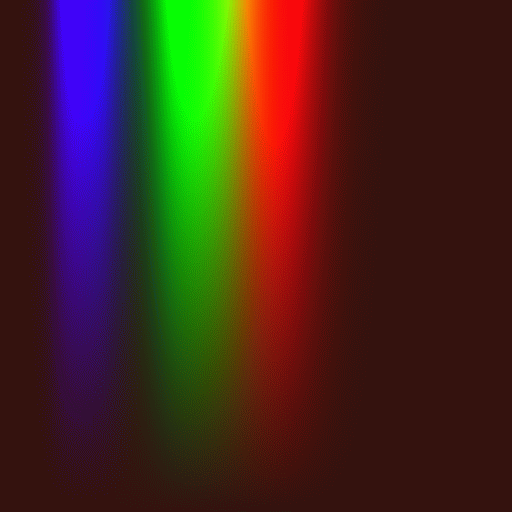
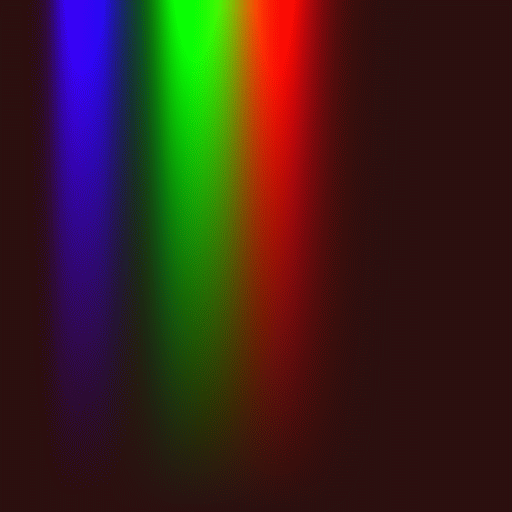
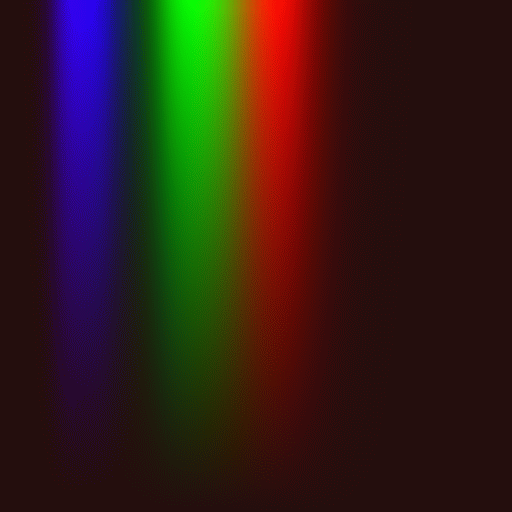
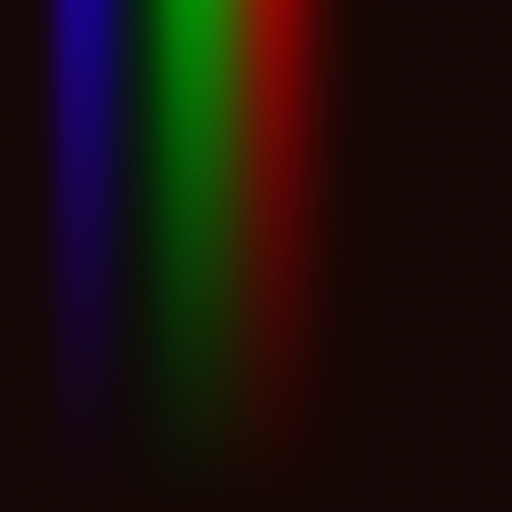
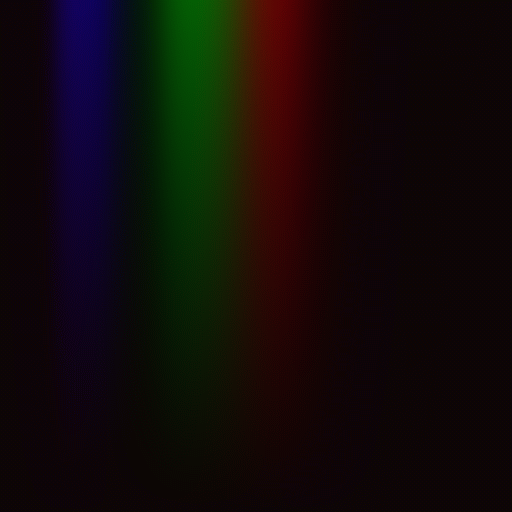

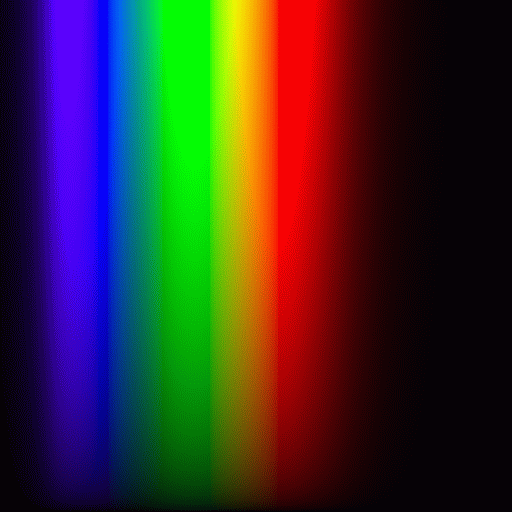
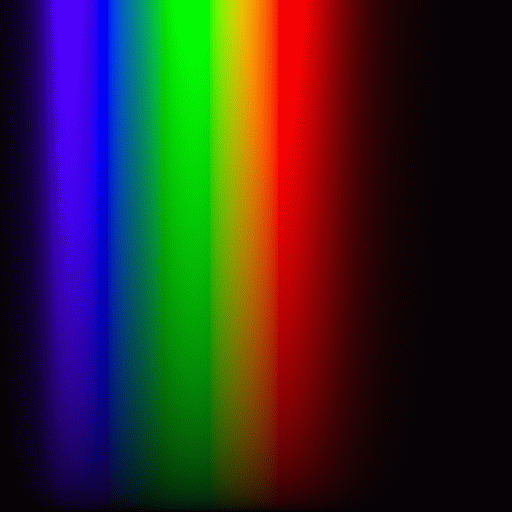
It came to my attention that perhaps there was another cool way to
make images. This was by clamping values around a different central
point.
